For years, players and coaches have sought to understand more about how to shoot correctly and consistently. Now, Noah is able to provide data that no one else has that helps shooters understand why their shot was a make or a miss and develop the mechanics to consistently shoot the ball straight at the optimal arc and depth in the basket. Shot charts are not a new concept, but Noah also provides data displayed on a rim map that has never been seen before in the history of the sport. The chart provides substantial proof as to why shooters want to shoot 11 inches deep into the basket.
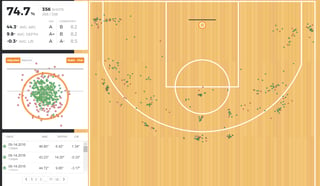
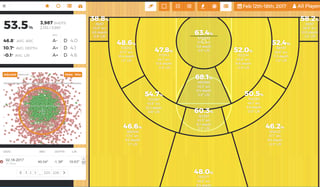
The Noah Shooting System is a sensor mounted 13 feet above the rim. The system captures the position of the ball 30 times per second, tracking entry angle, shot depth, position on the court, left-right position of the ball and whether or not the shot scored. This data is displayed in easy-to-read charts on the Noahlytics Data Service. One of the most recognizable charts on the Noahlytics site is the shot chart, which is an interactive shot chart allowing users to focus on the analytics for specific parts of the court. However, the unique rim map, which is a chart showing where all of the shots entered the hoop, provides an additional data set that has never been available before. There are several unique trends and insights that can be gathered by looking at this map, the color of the dot and the position of the ball in the rim.
On the Rim Map, a red dot indicates a miss, and a green dot indicates a clean make. There are also light green dots, which denote a dirty make. A dirty make means the ball bounced or spun around on the rim before going in. Occasionally a red dot may appear in the hoop, which is most likely a scenario where two shots were at almost the same time and one bounced out. The data shown on the rim map is measured when the center of the ball has gone through the hoop, thus measuring the point where the center of the ball crosses the rim, or in the case of a miss or a dirty make, where the center of the ball was when it changed trajectory.
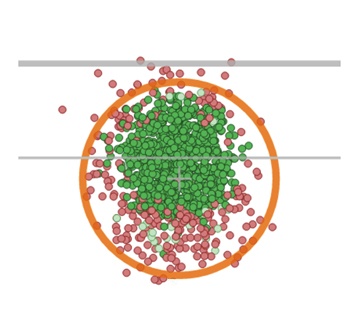 So, what does this data tell shooters about the ideal shot? When looking at a Rim Map after a workout, typically a shooter will see a cluster of data points that show up just past the center of the hoop. This indicates that more shots are made when players shoot deeper (optimally 11 inches deep) into the basket. Noah has coined the term “BRAD shot” to describe this concept. A BRAD shot, meaning Back Rim and Down, is actually the ideal shot. Think of it this way, if the ball enters the center of the rim, it is a swish and a make. If a ball enters the rim at 11 inches, or a little deeper, and the top half of the ball hits the back of the rim, it will force the ball down and into the goal, also get a make. If the ball enters short, then the bottom of the ball will hit the front of the rim and it will bounce up away from the goal. Occasionally when short, the ball will still bounce off the backboard or back of the rim and in, but typically this shot will be a miss a lot more times than it will be a make.
Using the Noah Shooting System, shooters can develop a BRAD shot that consistently gets to the back of the rim and scores or, even if they are short they still make it with a swish. After years of research and data from millions of shots, Noah Basketball determined that shooting 11 inches deep gave players the best opportunity to score. Now that the data from millions of shots can be displayed on the rim map, it tangibly shows that people make more shots when they shoot deeper in the basket as opposed to center.
The Rim Map enables players to understand why they should aim to shoot deep and shoot straight. Additionally, when players shoot with a 45-degree arc, they have the most control over the depth of their shot. Which is why the instant, audible feedback from the Noah Shooting System paired with the data from the Rim Map are two powerful weapons for developing a consistent shot when used together. Lastly, players can see how they shoot from different areas of the court. Data collected by the Noah Shooting System shows that some players shoot straighter from one side of the court in comparison to the other. The ability to filter the data out into specific areas of the court and see those shots in the Rim Map helps players understand where they need to focus their practice time.
All in all, the unique data set seen on the Rim Map has never been seen in the sport before, and Noah Basketball is the only one with this type of data. The analytics are helping players shoot more consistently by not only analyzing the data, but also providing instant, audible feedback in order to develop the right muscle memory for their shot technique. Noah Basketball is available for shooters at every level and offers free shooting clinics to allow players to experience the data found in the Rim Map for themselves. Request a clinic now to learn more about how this technology can help create more consistent shooters.
- - -